|
Posted: 05 Mar 2015 06:21 AM PST
NPR put together a nice graphic showing the most common job in every state every two years from 1978 to 2014. It’s a fascinating ride from secretaries, farmers, and machine operators to truck drivers, truck drivers, and truck drivers. Click to enlarge.
1978: 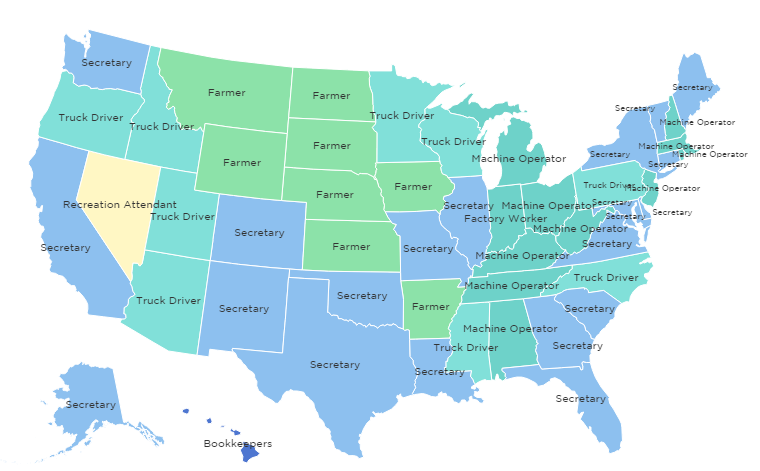 2014:  Quoctrung Bui explains some of the trends:
Here are some of the changes I found interesting, with mostly uninformed commentary. The three boxes represent 1978, 1996, and 2014. Methinks reality television is not telling me the truth about Alaska. Well, we know what Nevada‘s for. Except I guess people used to go there to do stuff and now they just go there to buy stuff. South Dakota and North Dakota, holding strong.  New York, the only state on the list that’s top job is nursing. Take that, Florida! New York, the only state on the list that’s top job is nursing. Take that, Florida!You go, Delaware. Lisa Wade is a professor of sociology at Occidental College and the co-author of Gender: Ideas, Interactions, Institutions. You can follow her on Twitter and Facebook.(View original at http://thesocietypages.org/ |
2015년 3월 5일 목요일
Sociological Images: Seeing Is Believing
피드 구독하기:
댓글 (Atom)
댓글 없음:
댓글 쓰기